Australians are optimistic about the future of crypto. Index sits at 42.
What is the IRCI?
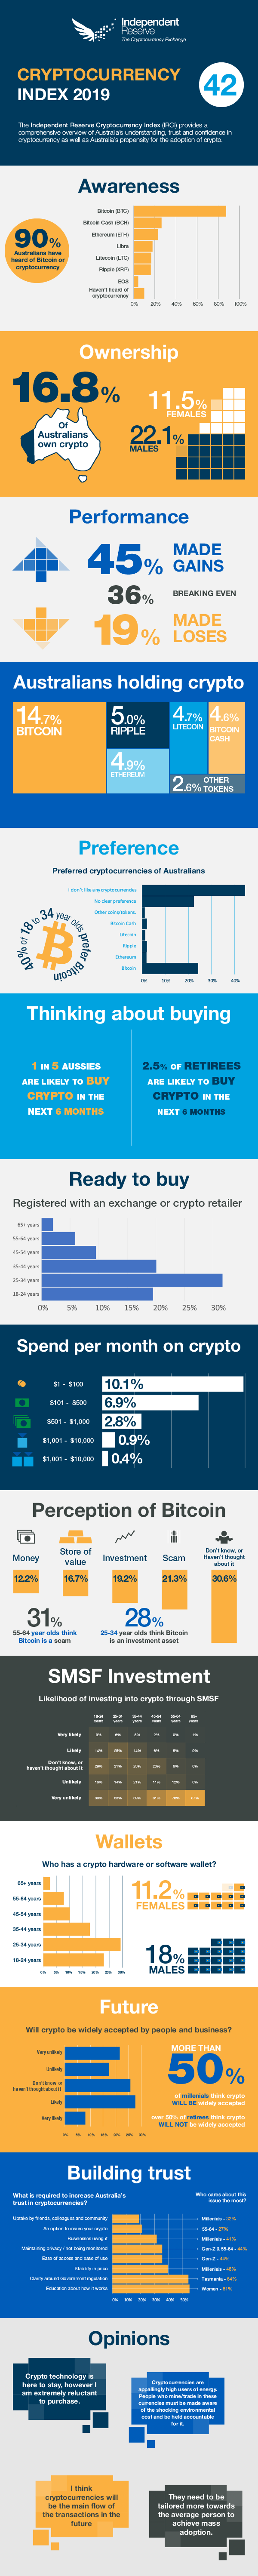
A first in Australia, the Independent Reserve Cryptocurrency Index (IRCI) 2019 is a research survey that examines Australia’s awareness, adoption, trust and confidence in cryptocurrency.
With a score out of 100, the inaugural IRCI sits at a benchmark of 42.
What does 42 indicate?
It’s not just the answer to the ultimate question of life, the universe and everything. In the context of cryptocurrency awareness, adoption and trust, it’s a number that indicates optimism and a maturation of the crypto industry.
100 would be full awareness, optimism, trust and adoption. 0 would be a society living under a rock, disconnected from the internet.
Many none crypto-holding respondents indicated a strong likelihood for adoption over the next 6 months. At the current rate of adoption, we estimate more than 50% of Australians under 34 will own crypto in the next 5 years.
Insights from IRCI 2019
- 17% of Australians own crypto
- 1 in 5 Australians are likely to buy bitcoin or other cryptos in the next 6 months
- Nearly half of crypto investors spend $100 or less per month
- A third of regular investors spend $100 to $500 per month on cryptocurrency
- Majority of Australians (under the age of 44) believe crypto will be widely accepted by people and businesses
- In five years, the majority of millennials and Gen-Z’s could own crypto
- Bitcoin is the most recognised and owned of all digital currencies in Australia
- More than 50% of millennials think crypto will be widely accepted in the future
- More than 50% of retirees think crypto will not be widely accepted in the future
There’s a lot more interest data available from the survey. Have a look at the infographic below for an overview of the responses.
Who participated in the IRCI?
1,000 Australians from all walks of life participated. The cross-sectional survey was geographically and demographically proportionate to Australia’s population.
Infographic
Love infographics? Great! Below is a summary of the IRCI 2019 survey.
Found the results interesting?
Share on Facebook, Twitter, LinkedIn, Insta and your other favourite social sites.
Writing a blog about the results? Feel free to download and share the infographic, we kindly ask that you reference this blog if doing so. You may also wish to checkout our press release regarding the inaugural IRCI.